FACEBOOK WEBSITE ANALYTICS
Journal / Strategic Insights / 28.04.17
Study your Visitors and make Smarter Business Decisions
Facebook recently revealed its Analytics solution where through Facebook pixel you can get the complete picture and discover valuable insights of your website’s visitors. It also lets you understand and optimize your complete customer journey across mobile, web, bots, offline and more. Below we point out some of its basic features and how you can take advantage of them.
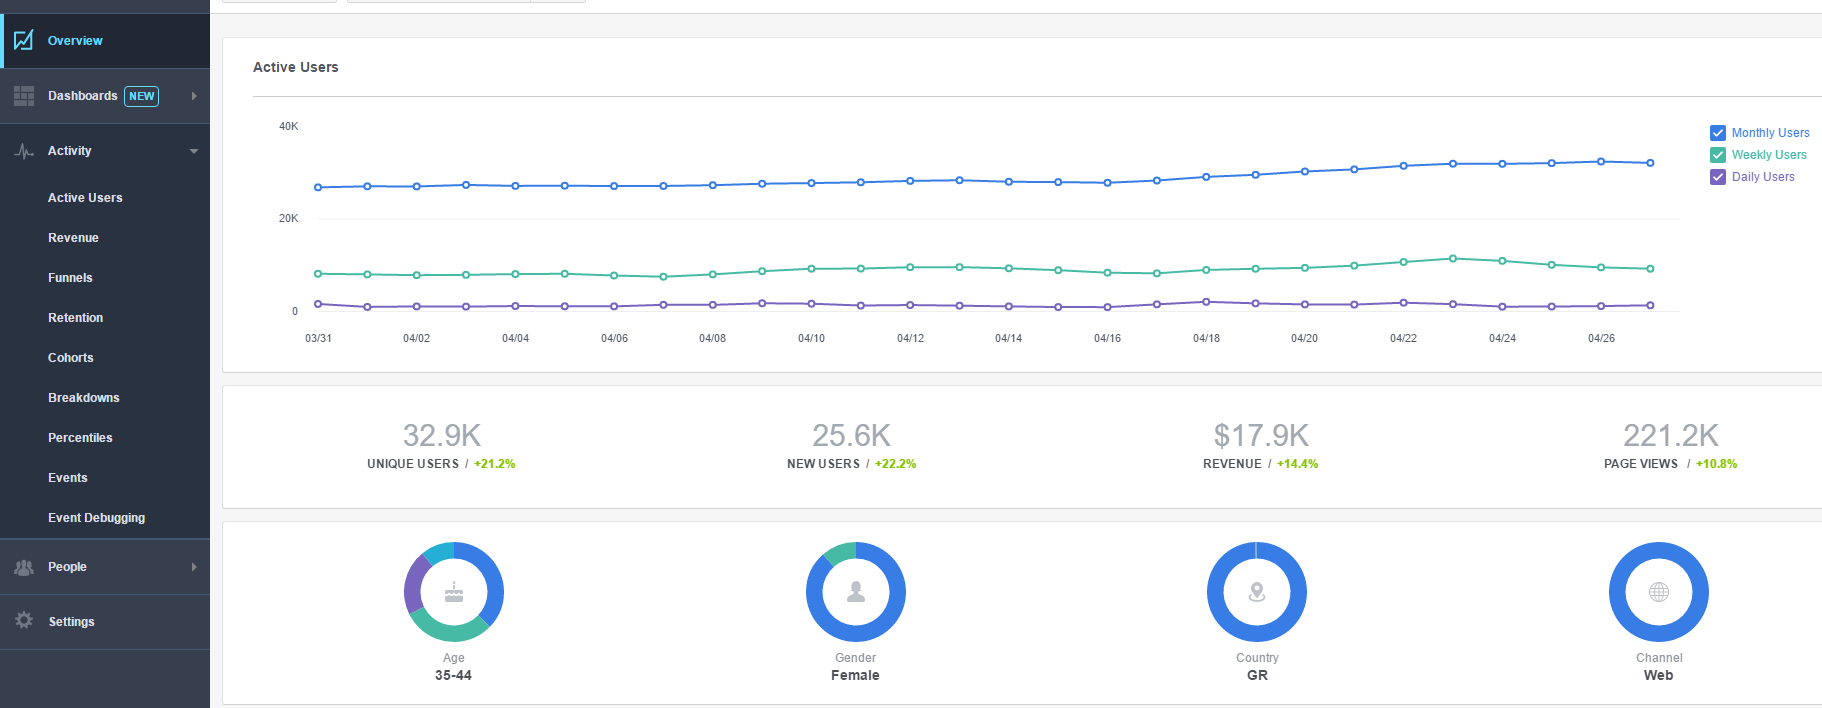
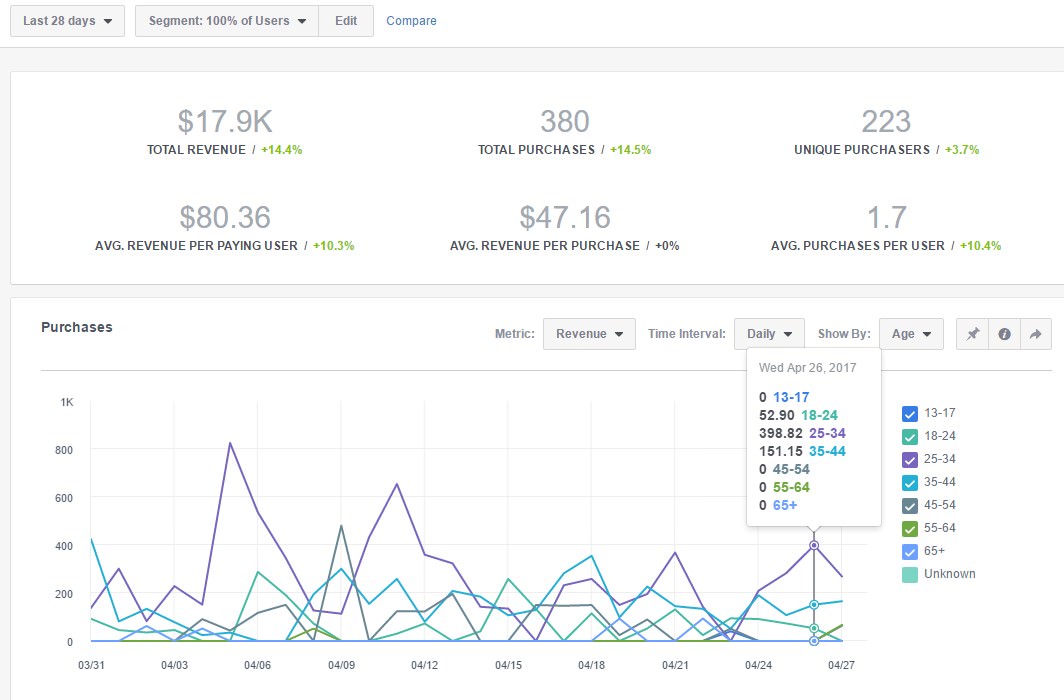
Overview
The overview section gives you all the required top-line data about your website including traffic from unique users, revenue, demographics information & device segmentation.
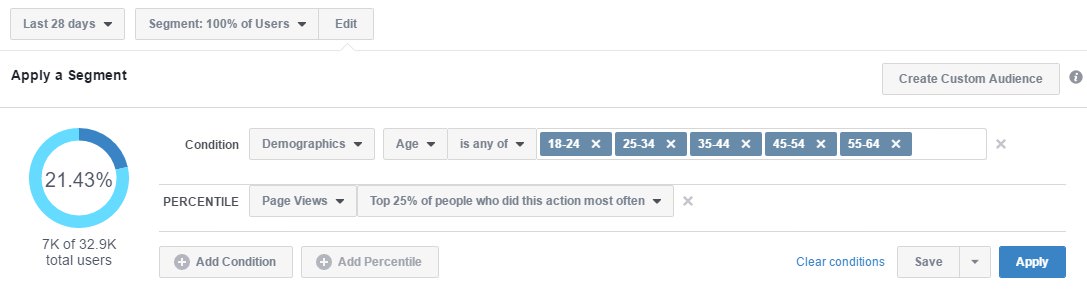
Segmentation
This is where magic begins! You can segment and monitor your audience based on users’ demographics & behavior in the website. The best part of segmentation is that you can save it and create a custom audience based on Facebook Analytics segmentation for later use in your Facebook Ads.
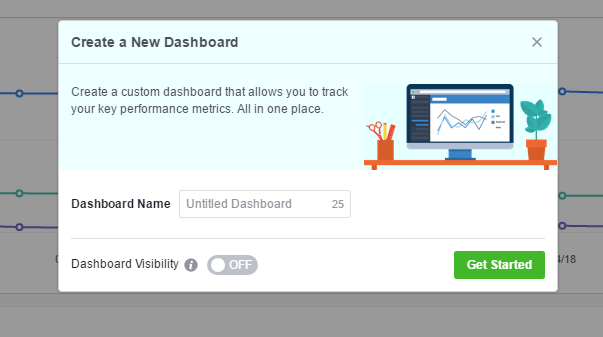
Dashboards
We all know that custom views of our website’s data always save time. Facebook Analytics dashboards provide an easy way to gather together all the insights you want to monitor in one screen. Give it a name and remember that you can quickly add widgets (most of them as dashboards are in beta phase at the time) in your custom dashboards from any subsection of Facebook Analytics just by clicking on the pin icon of the related chart.
You can also show custom Dashboards to any user with insights access making it easy to represent your data to your clients, colleagues, etc.
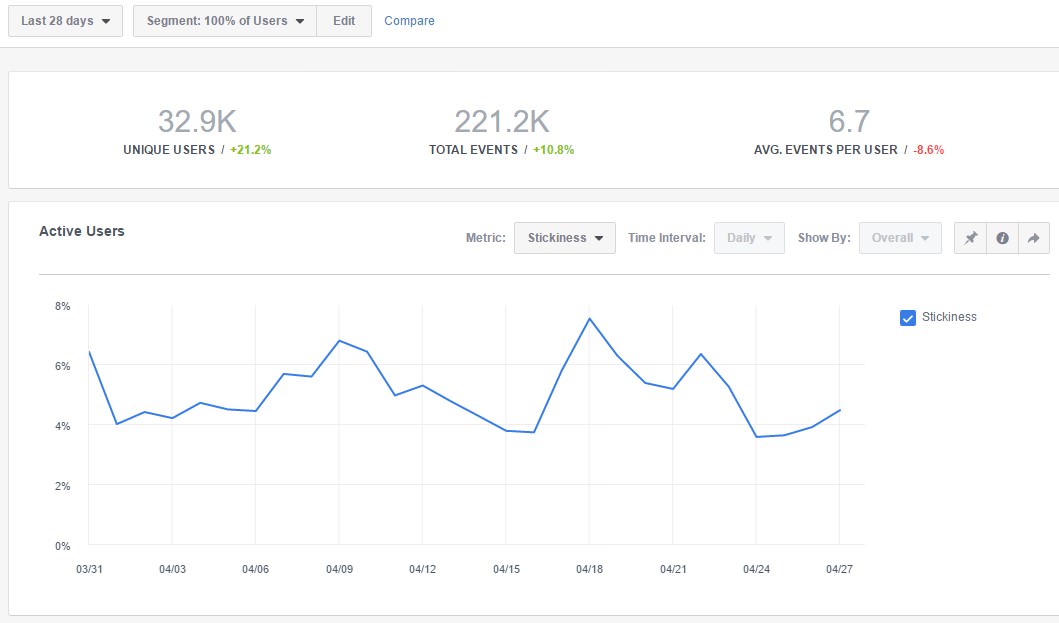
Active Users
The active users section is where you can monitor the daily performance of your website’s visitors. For example, you can track the stickiness of your visitors. Stickiness is a new Facebook KPI which reports what percentage of your monthly active users use your website every day.
Revenue
Revenue section gathers all the purchasing actions & data that your Facebook pixel has recorded through your purchase. So, make sure you can properly setup your purchase event in order to segment and analyze your audience based on the earned Revenue.
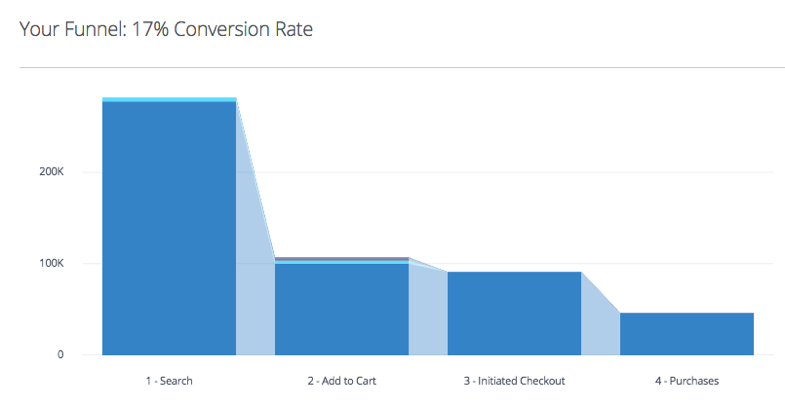
Funnels
Funnels are a series of events you choose that help you measure and optimize the customer experience. Funnels help you improve your conversion rate for registrations, checkouts, purchases and more. You can find out where your customers have trouble completing a task as for example when checkout flow is too long.
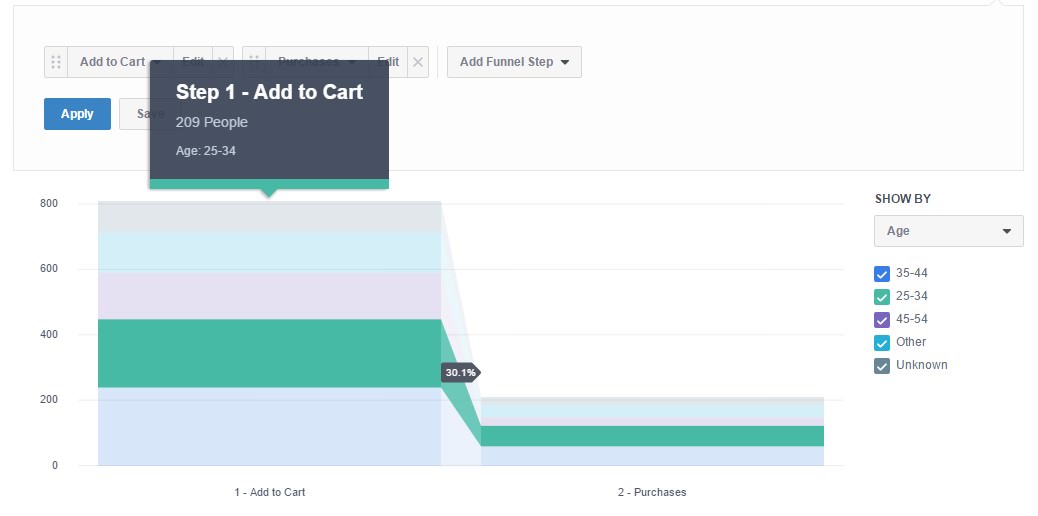
You can also find out which age group is the most engaged when the purchase time comes. In the image below, the most engaged audience is the age group of 25-34 where 30,1% of those who added a product in their cart also proceeded with the purchase.
Facebook Analytics Audiences
Along with the segmentation come the new capabilities of saving these segments as Audiences for your Facebook Ads! This is a feature that you can now create both from Facebook Analytics and from Facebook Audiences.
How to create an Audience through Facebook Analytics
- Access Segmentation from the filter menu in Facebook Analytics.
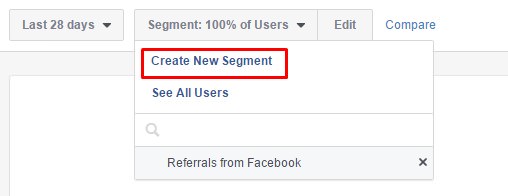
2. Create a new segment and select any condition and percentile you want to include.
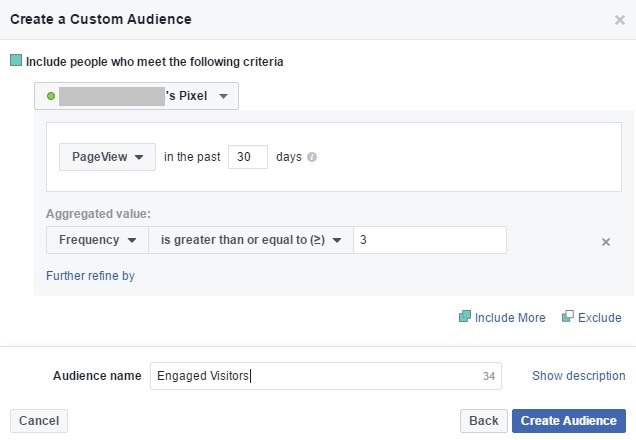
3. Click on the Create Custom Audience Button, give your Audience a name in the popup window and then click on the Create Custom Audience button.
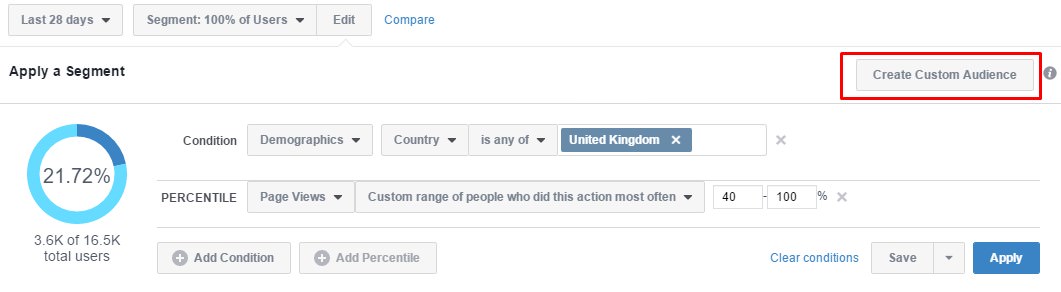
4. In the above segmentation, we have included all users who are located in the United Kingdom and show 3 or more pages in our website.
How to create an Audience through Facebook Audiences
- Navigate to Assets > Audiences > Create Audience > Custom Audience > Website Traffic
- Choose the following criteria:
3. Save that Audience.
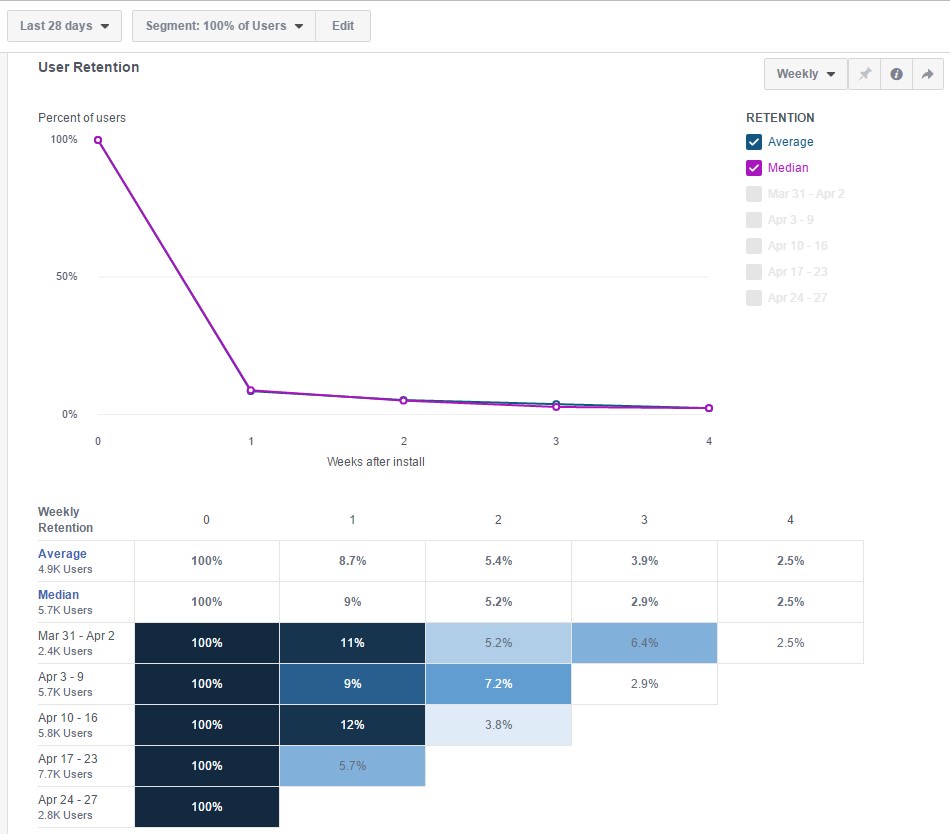
User Retention
Retention shows you the percentage of people who start using your website and then continue using it over time.
Each row in the retention chart represents a cohort of people who started using your website over a particular time period. Each column represents the unit of time you selected, such as days, weeks or months. As you review the retention rate for a particular cohort, you can see how it changes over time.
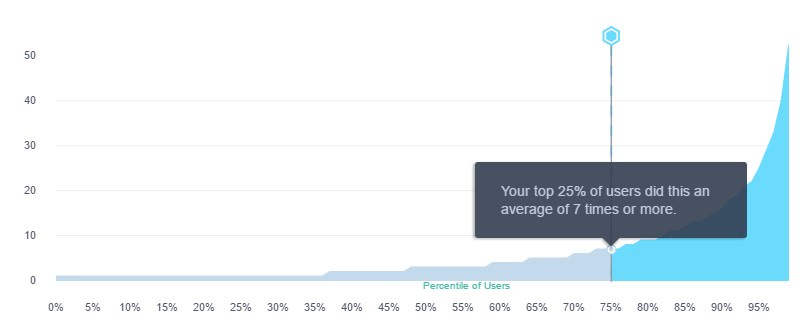
Top Customers
Through the Facebook Analytics Percentiles section, you can identify your top customers based on people who spend the most on your website or are the most engaged across your website. Then you can create custom audiences and lookalike audiences based on these criteria.
Analytics for Apps
Facebook Analytics features many metrics, data and functionalities which can also boost the performance of your app. You are able to:
- Send free, customizable push and in-app notifications based on the actions people take, such as abandoning their cart, completing a level and more.
- Filter your data based on users’ phones capabilities like their processor power, total available space in GB, screen size of the device, etc.
- Combine funnels with demographics to improve your conversion rate.
- Build cohorts to understand retention and LTV.
Recap
At last, Facebook revealed its Analytics solution. Of course, it’s missing many features like the ability to visualize data in different ways (tables, comparisons, pivots) and proper data filtering and grouping but It seems to be a must-have tool with robust capabilities in an online world where Facebook is everywhere. So, if you want to be at the edge of your industry’s trends, try Facebook Analytics and remember that:
- You can access Facebook Analytics through analytics.facebook.com
- It’s a completely free Analytics tool by Facebook
- It doesn’t require Facebook login
- You can better understand the customer journey
Resources
- https://analytics.facebook.com/
- https://developers.facebook.com/docs/analytics
- https://www.facebook.com/facebookanalytics/videos/622318631263096/
@ Mozaik we have 6 Certified Analytics Specialists who can study your data and transform simple correlations to actionable insights.
Contact us and start to understand better your customer’s behavior.